
Probe configuration: clear at a glance
Posted2026-9-4
MicroCore OS transforms probe configuration from "flipping through documentation" to "just a glance" via digital twin topology profiling. Real-time visualization of device-configuration relationships, automated conflict detection, and closed-loop completion of probe selection and validation—all within a single interface.
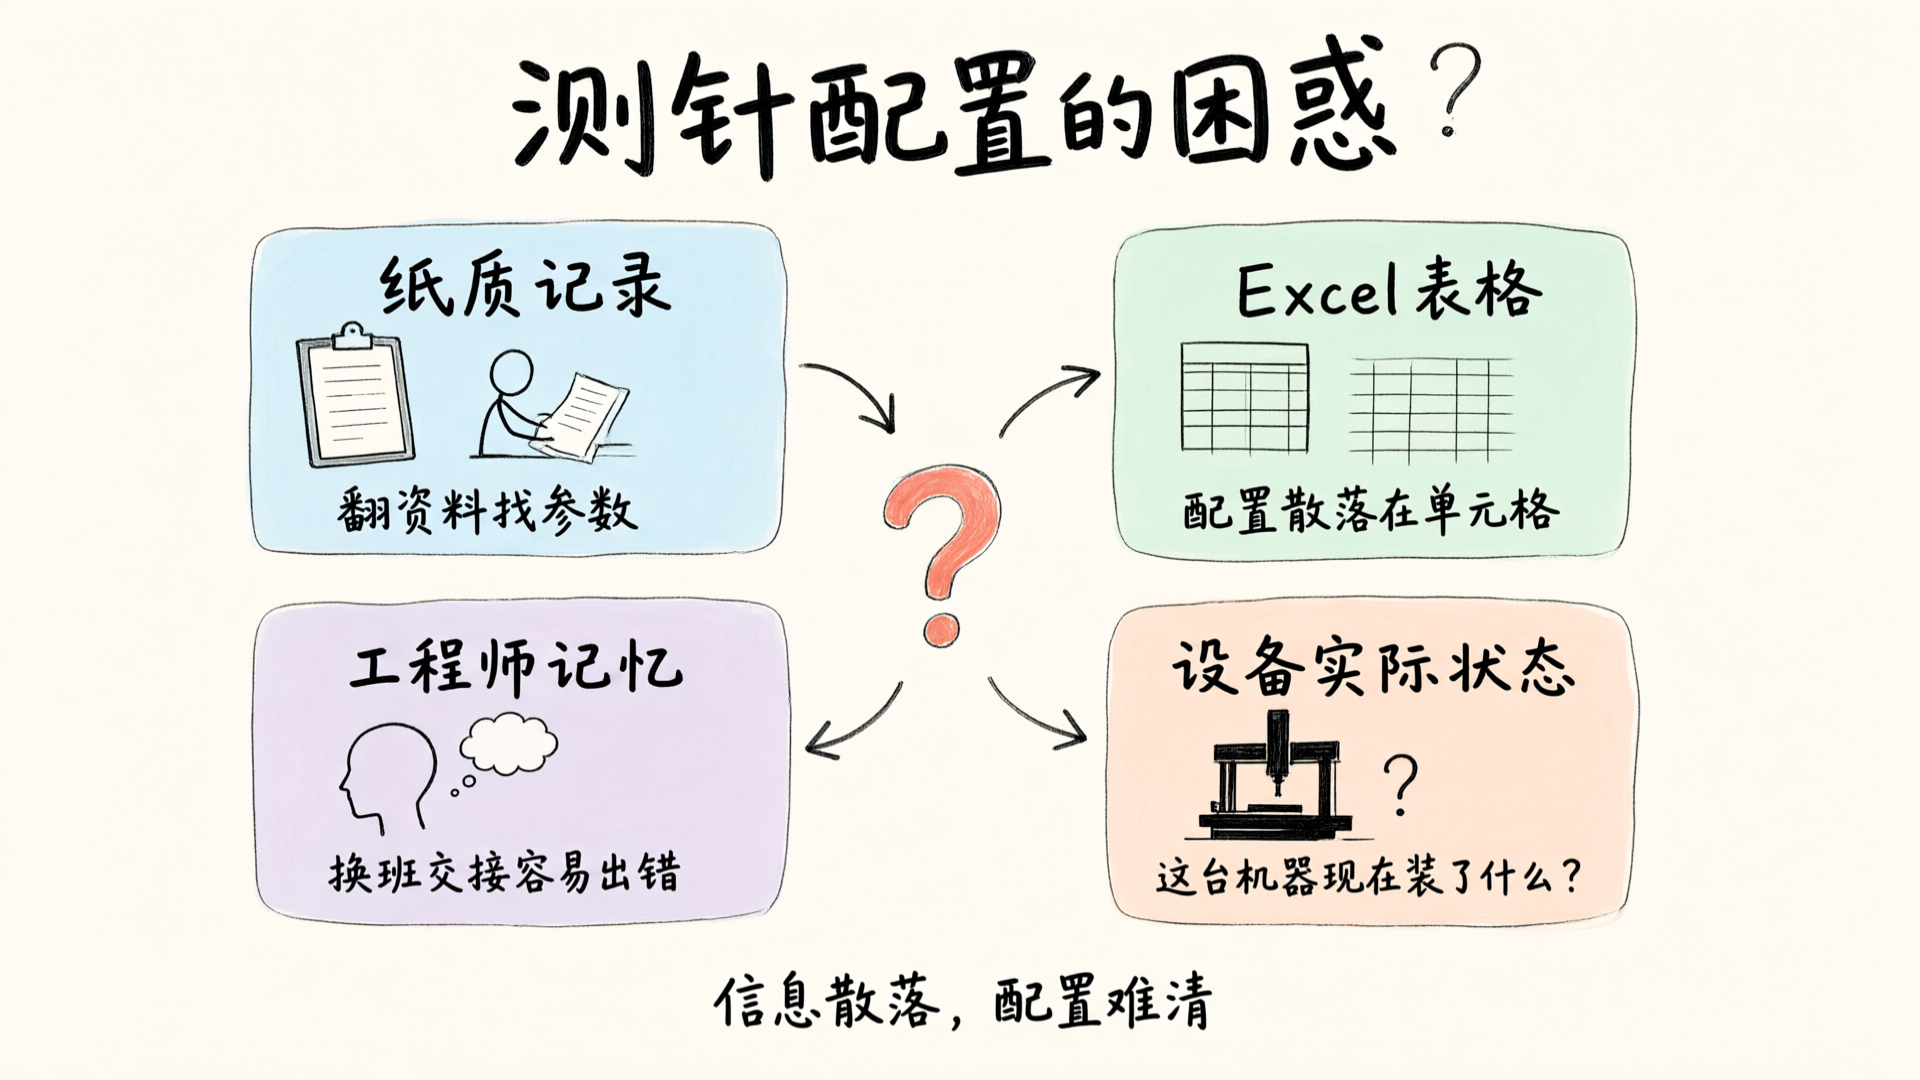
You've likely encountered this scenario: in a workshop, an Omni CMM has multiple probe heads and stylus assemblies swapped out, with stylus diameters ranging from 2mm to 6mm. The configuration sheet is packed with dense parameters. A new quality engineer stares at the list—Which probe head does this stylus fit? Can the current setup measure this part?
In all honesty, we've seen this confusion far too many times.
Probing configuration itself is straightforward, but when multiple probe sets, varying sizes, and different lengths are combined, details often end up scattered across paper records, Excel sheets, or engineers' heads. While equipment runs and configurations change, it's hard to instantly see "what exactly is installed on this machine right now."
When building MicroCore OS, we asked ourselves: Can we turn probe configuration from "digging through docs" into a "quick glance"?
Topology Profile: Visualize device configurations as a relationship graph.
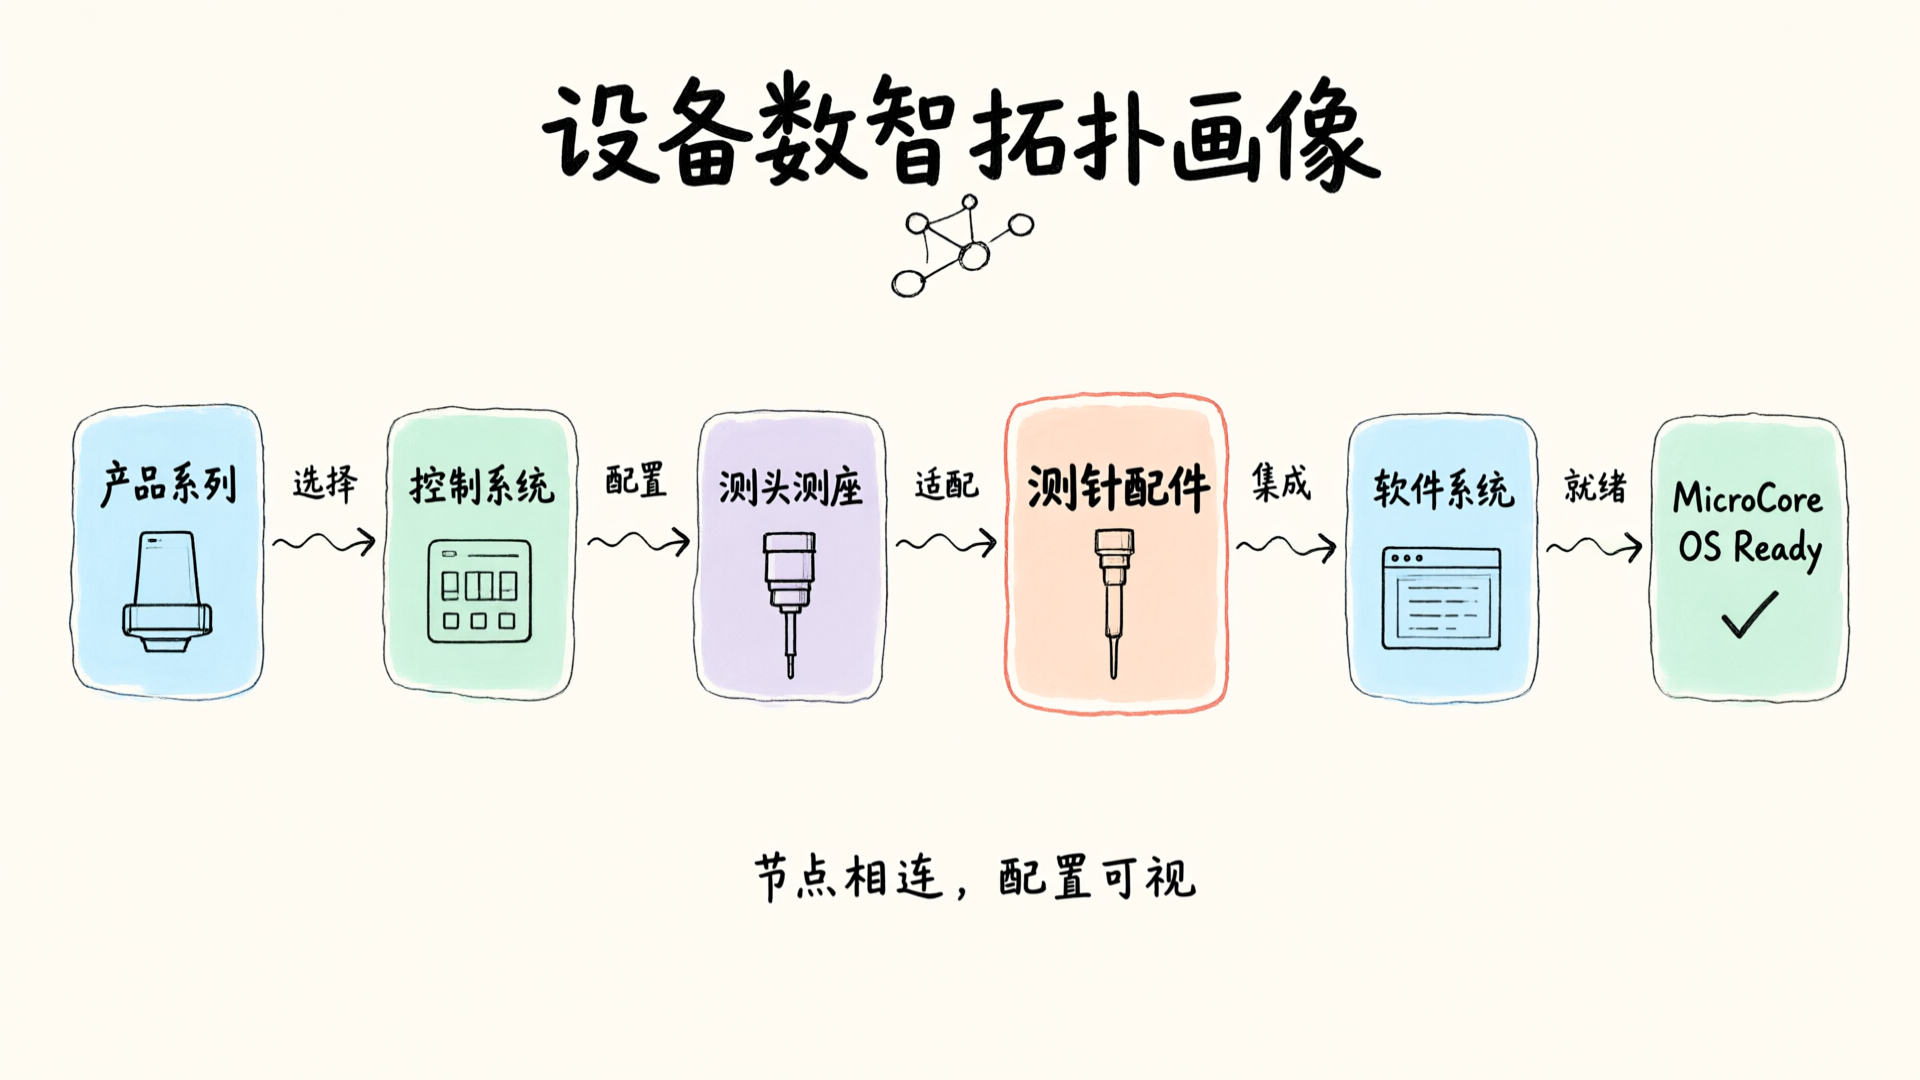
Let's start by discussing the term "Digital Twin Topology Profile." While it sounds technical, its core concept is simple: represent a device's components as nodes and connections, so you can instantly see what connects to what and how they're configured.
Open the device smart configurator in MicroCore OS, and you'll see an interactive node diagram on the right. Starting from the product series selection, it flows through control systems, probe heads, probe accessories, and software systems, finally converging to the "MicroCore OS Ready" status. Each node is not just a standalone icon but a dynamic data point carrying configuration details.
Where is the probe configuration? It's located in the "Probe Accessories (Kit Configuration)" node.
Click it to see the currently mounted probe combinations: which probe is installed on which station, its specifications, and applicable scenarios. This isn't static text—it's a dynamic view that reflects real-time device status. When you swap a probe, the node updates instantly.
Why visualize probe configuration?
You might ask: "I already have the probe configuration table, with all details clearly recorded in Excel. Why bother with visualization?"
The reason is simple: Excel is static, but devices are dynamic.
Real-world example: A 3C electronics production line operates five Omni measuring machines. Each machine's probe configuration is periodically adjusted based on specific inspection tasks. Previously, manual paper records were used, leading to frequent handover errors between shifts. In one incident, a night-shift engineer installed probes according to the day-shift schedule, which reflected last week's outdated configuration. The equipment had already been updated, resulting in significant measurement deviations. It took two hours of troubleshooting to identify that the probe specifications were incorrect.
Relying on memory or paper to track issues will eventually lead to errors.
The value of a topology profile lies in transforming probe configuration from "what was recorded" to "current status." When you open the interface, you see what's installed now—not what should be. Probe details on the node map directly reflect the device's live hardware state: when configurations change, the profile updates instantly. No need to dig through history or ask the previous shift—just glance at the node map to know the current setup.

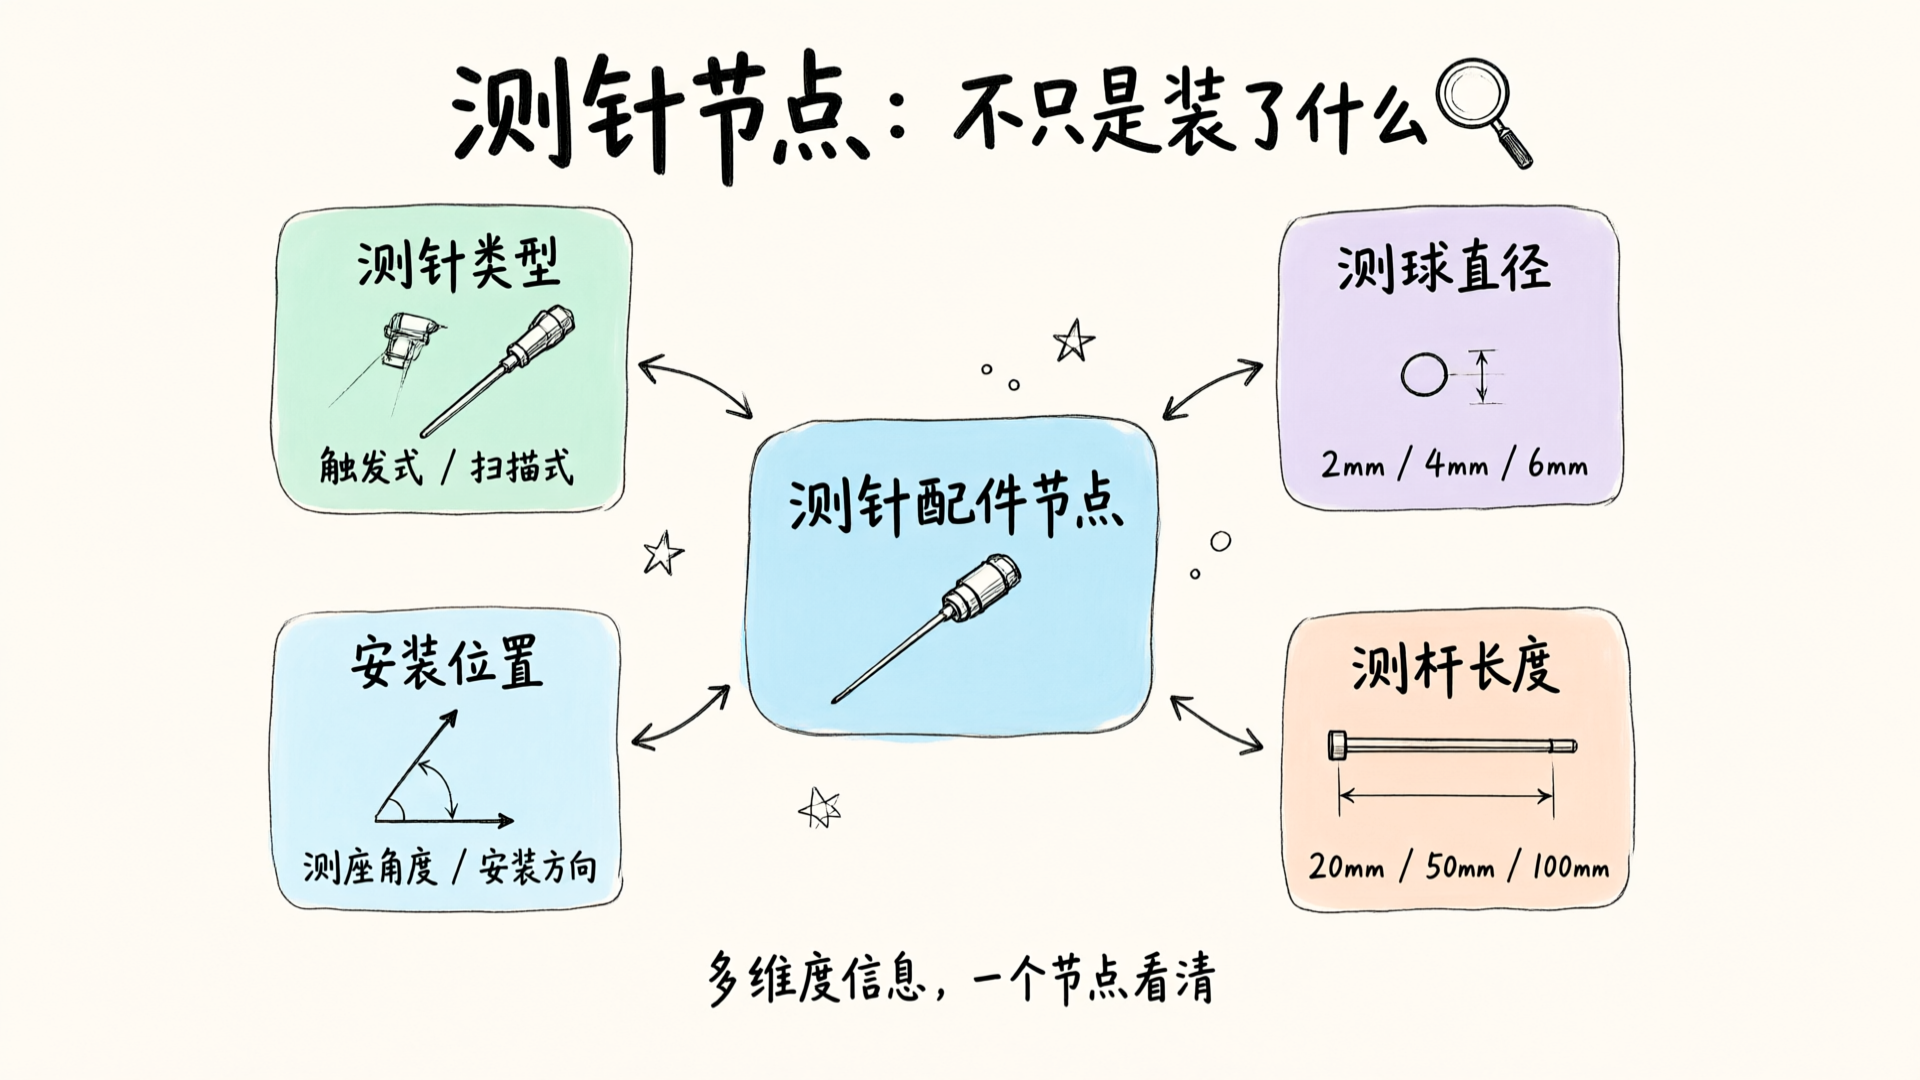
Probe Node Details: More Than Just "What's Installed"
Let's zoom in on the probe accessory node.
When you click, you see more than just a probe model. The node displays the complete probe kit configuration: probe type (trigger or scanning), stylus tip diameter, stylus length, and mounting position (which probe head angle it's installed on). Together, these details form the full picture of "probe configuration."
Why detail all this? Probe configuration isn't defined by a single parameter. A probe with a 4mm stylus ball and 5mm extension behaves differently depending on its angle in the mount—its reach and accuracy vary. Knowing you have a "4mm probe" installed isn't enough; you must know its orientation to determine if it can measure the target feature.
Topology profiles consolidate this information into a single node, visualized for clarity. No need to mentally piece together probe specifications, seat angles, and installation positions—the node diagram presents them all at once.
From "View Configuration" to "Select Configuration": The Configurator Loop
Topology profiling isn't just for viewing—it also helps you select.
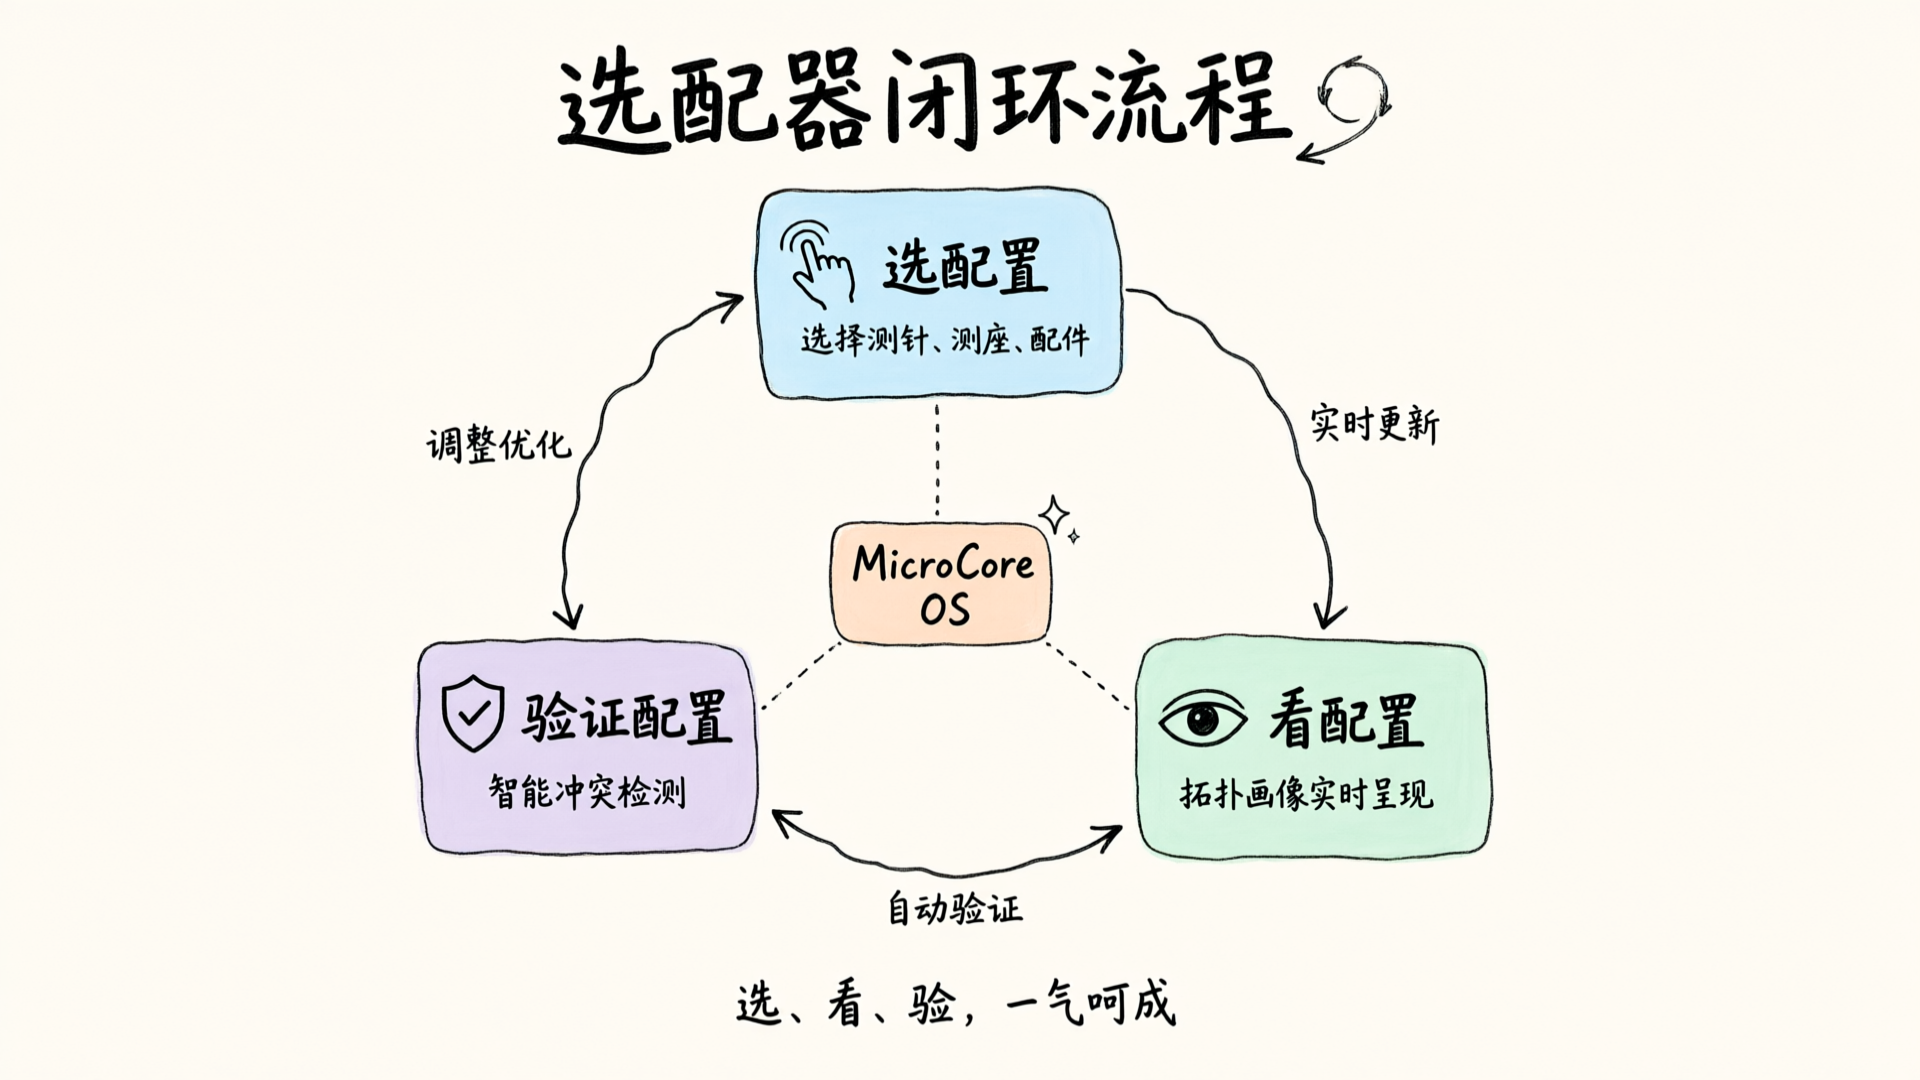
The device smart selector works as follows: Choose the base model and accessories on the left, and the topology diagram on the right updates in real time to visualize your current configuration. When selecting a probe accessory, the diagram instantly displays the pairing between your chosen probe and its corresponding socket.
There's also a hidden value here: conflict detection.
Probe and socket compatibility follows specific rules—not all probes fit all sockets, and not all combinations achieve rated accuracy. Previously, selecting accessories relied on engineer experience or manual cross-referencing. Now, when you select a probe in the configurator, the system immediately flags incompatible combinations. On the topology map, this node displays "This combination has issues" rather than waiting for post-installation measurement errors.
From selecting to reviewing and validating configurations—all within a single interface. No need to leave the configurator to check manuals or open another tool to verify compatibility. The entire configuration process is visual, from start to finish.
Visualizing the Invisible: Making Device Status Perceptible
Ultimately, the visualization of probe configuration is just one facet of the topological profile.
When building MicroCore OS, we focused on one key principle: device status must be perceptible to the operator. Instead of waiting for issues to arise and then troubleshooting, you should be able to open the interface at any time and immediately see the device's current state, installed configurations, and available tasks.
Probe configuration is just one piece of the puzzle. Control system version, probe and spindle models, and software status are all consolidated into a single topology profile. What you see isn't a scattered parameter list—it's a complete digital twin of the equipment.
This is where "digital twins" land in measurement equipment—not just creating a visually appealing 3D model, but making the device's configuration, operational status, and capability boundaries instantly understandable.
Next time you stand before an Omni CMM and wonder what probe is mounted or which parts it can measure, skip the logbook and don't ask colleagues. Open MicroCore OS and check the topology profile—the answer is right there.
Configuration should be clear at a glance.